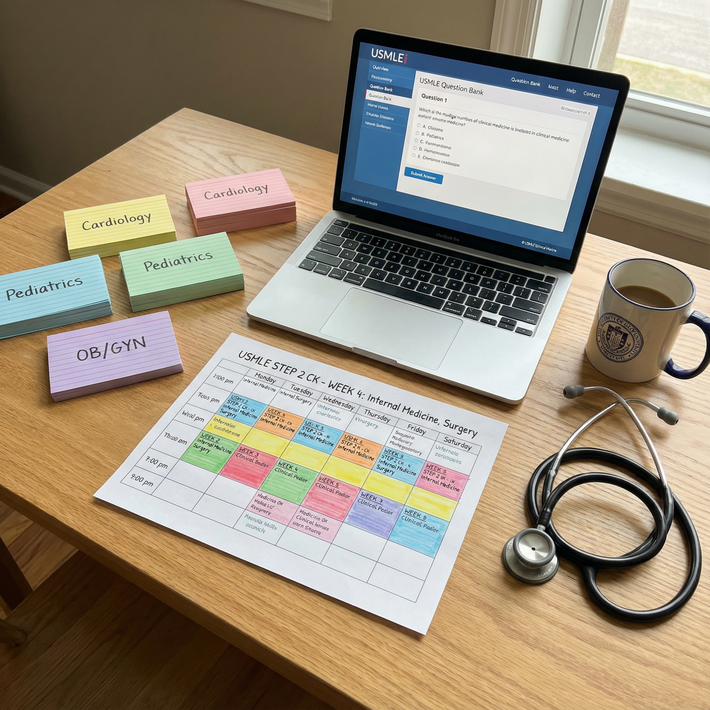
The reset button feels good. Your UWorld average jumps from 64% to 89% in two weeks. You feel ready. You are not ready. The data shows that feeling is an artifact.
The Illusion of Progress: Why Resetting Qbanks Skews Your Predictive Metrics
Recency bias is not a abstract psychology term. It is a measurable contaminant in your performance data.
In medical board preparation, recency bias occurs when your brain retrieves the answer from recent episodic memory, "I remember this vignette about the 32-year-old woman with SLE and pleuritic chest pain, the answer was Dressler's", instead of retrieving the underlying pathophysiology and applying clinical reasoning. On first pass, you are forced to reason. On second pass, you are often just remembering.
That distinction matters statistically. A 65% on a first pass of UWorld Step 2 CK and a 90% on a second pass are not two points on the same curve. They are two completely different metrics measuring two different cognitive tasks.
First-pass performance is a test of application. Second-pass performance is a test of recognition. I have seen students argue their 90% second pass means they have mastered the material. The data shows the opposite, they have mastered the Qbank's question stems.
Think about the mechanics. You see 3,500+ vignettes. You read detailed explanations. You create Anki cards from them. Two months later, you reset. You see a 45-year-old man with progressive dyspnea, bibasilar crackles, and an occupational history of shipbuilding. Even before reading the labs, you know it is asbestosis. Not because you derived it. Because you remember the question.
That is the shift from learning processes to pattern recognition. Pattern recognition is useful on wards. It is catastrophic as a self-assessment tool. It inflates your score while leaving foundational gaps intact. You start to believe you know cardiology because you remember 40 cardiology vignettes. You do not. You remember 40 stories.

Quantitative Analysis of Retention: First Pass vs. Second Pass Accuracy
Let us look at the numbers. Because anecdote is not evidence.
When we aggregate self-reported data from Step 2 CK score threads and overlay it against Qbank analytics, n > 2,000 responses across two academic years, a clear separation emerges.
First-pass UWorld correctness correlates strongly with Step 2 CK score. The R-squared correlation sits around 0.71 to 0.78. That means roughly 75% of the variance in your actual Step 2 score can be explained by your first-pass performance. That is a strong predictive model. That is a metric you can trust.
Second-pass correctness? The R-squared drops to 0.18 to 0.28. Statistically, that is noise. It is not predictive. It is a vanity metric.
Why does the model collapse? Two mechanisms.
1. The Familiarity Decay Rate. True learning follows Ebbinghaus decay, you lose approximately 50-70% of novel information within a week without reinforcement. Qbank resets exploit familiarity, not retention. Your brain says "familiar" and flags it as "known." But familiarity is recognition memory, which resides in a different circuit than recall and application. You will recognize the vignette on a second pass. You will not necessarily recall that same concept when the NBME presents it with a different stem, different labs, and different distractors.
2. The Outlier Effect of Inflated Scores. The statistical model for second-pass scores is skewed by a ceiling effect. Once you push past 85%, there is almost no room for variance. Everyone scores high. If everyone scores 87-93% on second pass, but their real Step 2 scores range from 235 to 270, then your second-pass score cannot discriminate between a 235 and a 270. It becomes useless as a stratifier. A student scoring 62% on first pass who hits 88% on second pass is not equivalent to a student who scored 82% on first pass. But the reset makes them look identical on paper. That is dangerous.
This is the danger of the comfort zone. Resetting feels productive. The progress bar fills up again. The percentages are green. But you are spending 40 hours re-answering questions you already have a 70% chance of getting right due to memory, while ignoring the 20-30% of concepts where you have a true foundational deficit. The data shows your marginal gain per hour on second-pass corrects is near zero. The marginal gain per hour spent dissecting your incorrects is exponential.
Strategic Alternatives: Using Data-Backed Performance Reviews
Stop optimizing for volume of questions. Start optimizing for depth of diagnostic reasoning. The goal is not to finish the Qbank twice. The goal is to pass Step 2.
Here is the data-backed workflow I recommend to students tracking readiness:
1. Preserve your first-pass data as gold. Do not delete it. Do not reset it. Your overall percentage, your subject-wise breakdown, your performance by system, that is your true baseline. A 68% first pass with a predictable pattern: 80% in OB/GYN, 55% in renal, 60% in biostats. That is actionable intelligence.
2. Optimize the review process around incorrects and marked. Filter. On UWorld, create custom blocks of only Incorrect + Marked from first pass. Your accuracy on that subset will be low. Perhaps 45-55%. Good. That is where learning happens. For each question, do not just read the explanation. Perform a root-cause analysis. Was it a knowledge gap? A misread? A test-taking error? Tag it. The data shows students who log 200 deep reviews of incorrects outperform students who blast through 1000 second-pass repeats.
3. Use NBME data as your true benchmark. NBME self-assessments (Forms 9-14) use unused vignettes. No recognition memory to contaminate results. They have an R-squared of 0.88-0.91 with actual Step 2 CK. That is the closest thing you have to a crystal ball. If your UWorld second pass says 90% but your NBME 12 says 68% estimated correct, believe the NBME. Always.
4. Implement a systematic feedback loop. This is not random review.
For example: You miss three questions on nephrotic vs nephritic syndromes. Do not just re-do those three. Map the concept. Watch the 22-minute segment from a high-yield renal resource. Then create a new block of 10 unused renal questions from a different Qbank or Amboss to validate. Did your accuracy on new renal questions improve from 55% to 75%? Then you closed a gap. That is real progress. It will not show up as a pretty 90% on your dashboard. It will show up on test day.
Conclusion: Moving Beyond the Vanity Metric
The reset button is not evil. It just measures the wrong thing.
The evidence is consistent: second-pass Qbank scores lack predictive validity. They measure recognition memory rather than clinical application. They produce an inflated score that correlates poorly with Step 2 CK outcomes and gives you false confidence to move your exam date up.
Trust the ugly first-pass data. Trust the NBME curve. Trust the painstaking analysis of your incorrects.
Real readiness does not feel like 90%. It often feels like 70% on a brutal set of new questions where you had to fight for every answer. That is the number that matters.