The data shows a familiar and dangerous pattern: an AI triage score can look excellent at launch, then quietly degrade while everyone keeps citing the original validation slide. That is how under-triage creeps in. Not with a dramatic collapse. With a 1-2 point sensitivity drop here, a calibration shift there, and a workflow change nobody thought mattered.
I have seen this happen in emergency settings where the model team celebrated an AUROC above 0.90, clinical leadership felt reassured, and six months later the bedside reality was worse than the dashboard suggested. The reason is simple. Launch data is a snapshot. Real emergency departments are moving targets.
This article treats the problem the way it should be treated: numerically. We will compare early-launch performance with post-launch behavior using four lenses, drift magnitude, calibration change, safety-threshold breaches, and subgroup stability. The goal is not abstract model criticism. It is risk quantification. How much did sensitivity fall? How much did under-triage increase per 1,000 visits? Which subgroups absorbed the harm? Those are the questions that matter.
Why Triage Scores Drift: Data, Model, and Workflow Forces
Performance drift in ED triage means more than a lower AUROC. The data shows drift can hit at least four layers at once:
- Accuracy drift: weaker discrimination between high- and low-acuity patients
- Calibration drift: predicted risk no longer matches observed risk
- Fairness drift: one subgroup deteriorates while aggregate metrics look fine
- Operational drift: downstream routing and escalation patterns worsen
That last one gets ignored too often. Bad mistake. In triage, operational outputs are part of safety. If the score pushes 6% more patients into fast-track and the escalation-back rate rises from 4% to 7%, the workflow is telling you something the model card never will.
What drives drift? Usually not one thing.
The biggest contributors are predictable:
- Case-mix shift. Respiratory season, behavioral health surges, boarding, heat waves, influenza, trauma clustering. Baseline prevalence changes and the model's old assumptions start to crack.
- Time-of-day effects. Night shift documentation is often shorter. Weekend staffing differs. Input completeness changes by hour.
- Documentation changes. A new triage template, more free text, fewer structured complaint fields. I have seen note-length distributions change by 30% after a workflow redesign.
- Acuity coding updates. If the operational definition of final acuity changes, your labels drift even if patient severity does not.
- Integration latency. Delayed vitals ingestion or missing arrival-mode fields can quietly distort predictions.
Early launch baseline should be defined tightly. Usually that means launch month, or the first 4-6 weeks post go-live, compared against rolling monthly windows afterward. If you let the baseline float, you can rationalize anything. That is governance theater, not monitoring.
Early Launch Data: Establishing the Baseline We Thought We Had
At launch, most teams report the usual metrics. AUROC. Sensitivity and specificity at a chosen high-acuity threshold. Positive predictive value and negative predictive value. Calibration slope and intercept. Sometimes Brier score. Sometimes under-triage. Too often, not enough subgroup detail.
For ED triage, "good performance" has to be defined around harm, not elegance. I do not care that your AUROC is 0.91 if your under-triage rate is rising. In this setting, safety means minimizing false reassurance. A patient who should have been routed to monitored evaluation but gets sent down a lower-acuity path is not a statistical inconvenience. That is the failure mode.
A realistic early-launch baseline might look like this:
- AUROC: 0.91
- Sensitivity at high-acuity threshold: 0.92
- PPV: 0.41
- NPV: 0.98
- Calibration slope: 1.02
- Calibration intercept: 0.01
- Expected calibration error (ECE): 0.03
- Under-triage rate: 12 per 1,000 ED visits
On paper, that is strong. The data shows the trouble starts when teams assume those figures are durable.
What should a baseline include? At minimum:
- Threshold-linked safety metrics
- Sensitivity at the routing threshold
- Under-triage rate per 1,000 visits
- Escalation rate after initial triage
- Calibration metrics
- ECE
- Brier score
- Calibration slope/intercept
- Reliability curves
- Operational metrics
- Fast-track routing proportion
- Monitored-bed assignment proportion
- Mean time-to-provider
- Subgroup analyses
- Age bands
- Chief complaint clusters
- Arrival mode
- Language preference proxy if available
- Documentation pattern strata, including structured vs free-text-heavy encounters
Subgroup baselines matter because aggregate stability is often fake stability. I have reviewed deployments where the global sensitivity fell just 2 percentage points, but in older adults with weakness, dizziness, or atypical chest symptoms, the drop was 6-8 points. That is not noise. That is clinically meaningful drift hidden by averaging.
Baseline performance should also be tied to a confidence interval. If launch sensitivity is 0.92 with a 95% CI of 0.90 to 0.94, and six months later you are at 0.86 with a CI of 0.84 to 0.88, the decline is not philosophical. It is measurable.
Measuring Drift Correctly: Metrics That Matter in ED Triage
The data shows that ED drift monitoring fails when it is reduced to one graph. Usually AUROC. That is lazy.
A proper metric set covers three domains.
1. Discrimination
- AUROC
- AUPRC if high-acuity outcomes are relatively infrequent
- Class-wise performance if the triage score outputs multiple acuity bins
2. Calibration
- ECE
- Brier score
- Calibration slope and intercept
- Reliability curves across deciles or clinically meaningful bins
3. Decision safety
- Sensitivity at the high-acuity threshold
- Under-triage rate per 1,000 visits
- Net change in false negatives among admitted, ICU, or rapid-escalation patients
Then add operations:
- Percent routed to fast-track
- Percent assigned to monitored bays
- Mean time-to-provider
- Percent escalated within 30-60 minutes after initial triage
That last metric is one of my favorites because it catches practical harm. If escalation-after-triage rises from 5.1% to 7.4%, you do not need a seminar on theoretical fairness. You have a workflow signal.
Uncertainty matters too. If labels are delayed until discharge diagnosis or final clinician review, then performance estimates lag reality. Handle that explicitly.
Best practice includes:
- Bootstrap confidence intervals for monthly metrics
- Predefined minimum sample sizes before subgroup interpretation
- Label latency tracking, so you know which months are still incomplete
- Rolling windows, such as 14-day and 30-day estimates, to balance speed and stability
A sharp governance team will also distinguish between statistical and clinical significance. A sensitivity drop from 0.92 to 0.90 may or may not matter clinically depending on baseline event volume. In a 60,000-visit annual ED, even a 2-point drop can translate into dozens of additional under-triaged high-risk patients. The data should always be converted back into counts. Percentages are easy to ignore. Extra harmed patients are not.
Subgroup Stability: Where Drift Usually Hides
This is where weak monitoring programs fail. They stop at the global average.
Drift usually hides inside strata:
- Adults over 75
- Patients with non-specific complaints
- Behavioral health presentations
- Non-English documentation pathways or proxy language groups
- High comorbidity index bins
- Arrival-by-EMS vs walk-in
Suppose the overall model AUROC stays near 0.90. Looks fine. But the sensitivity in older adults falls from 0.90 to 0.84, while ECE increases from 0.04 to 0.09. That subgroup is carrying disproportionate risk. The model has drifted in a clinically important way even though the executive summary remains comforting.
My rule is blunt because it works: trigger an investigation if any safety-relevant subgroup shows either:
- Relative sensitivity decline of 5% or more, or
- Calibration error above a preset threshold, such as ECE > 0.06, or
- Under-triage increase that exceeds confidence bounds of baseline
That is not overreacting. That is what responsible deployment looks like.

Causal Hypotheses for the Observed Drift vs Early Launch Assumptions
When you detect drift, do not jump straight to retraining. First identify the mechanism. The data usually gives you a ladder.
Start with base rates. Did high-acuity prevalence rise? If the launch month had 14% high-acuity encounters and month six is at 19%, threshold behavior can shift even before the model itself "breaks."
Next compare feature distributions. Population Stability Index, or PSI, is a practical signal.
In a typical analysis, I would flag:
- PSI < 0.10: little shift
- 0.10 to 0.25: moderate shift
- > 0.25: major shift worth urgent review
If triage note length bin is 0.31 and structured history completeness is 0.22, that screams documentation change. I have seen exactly this after triage staff were pushed to move faster during crowding. Notes got shorter. Structured fields got skipped. The model lost information and calibration deteriorated.
Then check label definition changes. If final acuity criteria were revised, or if admission status became easier or harder to assign due to boarding, your outcome target changed. That is not model drift alone. That is label drift.
Finally, run calibration-by-feature and segment analyses. If miscalibration is concentrated in walk-in abdominal pain, overnight respiratory complaints, or older adults without complete vitals, you are close to root cause.
Safety Thresholds and Governance: Converting Drift into Action
Monitoring without action thresholds is decoration.
A serious ED deployment should define quantitative safety gates before launch:
- Minimum sensitivity at high-acuity threshold: for example, not below 0.90
- Maximum under-triage ceiling: for example, not above baseline plus a clinically justified margin
- Maximum acceptable calibration error: such as ECE not exceeding 0.06 or slope falling below 0.90
Then you need governance rules:
- Nightly or weekly dashboard review for technical signals
- Monthly clinical review with subgroup summaries
- Immediate incident review if a safety gate is crossed
- Rollback or threshold adjustment criteria if deterioration persists across consecutive windows
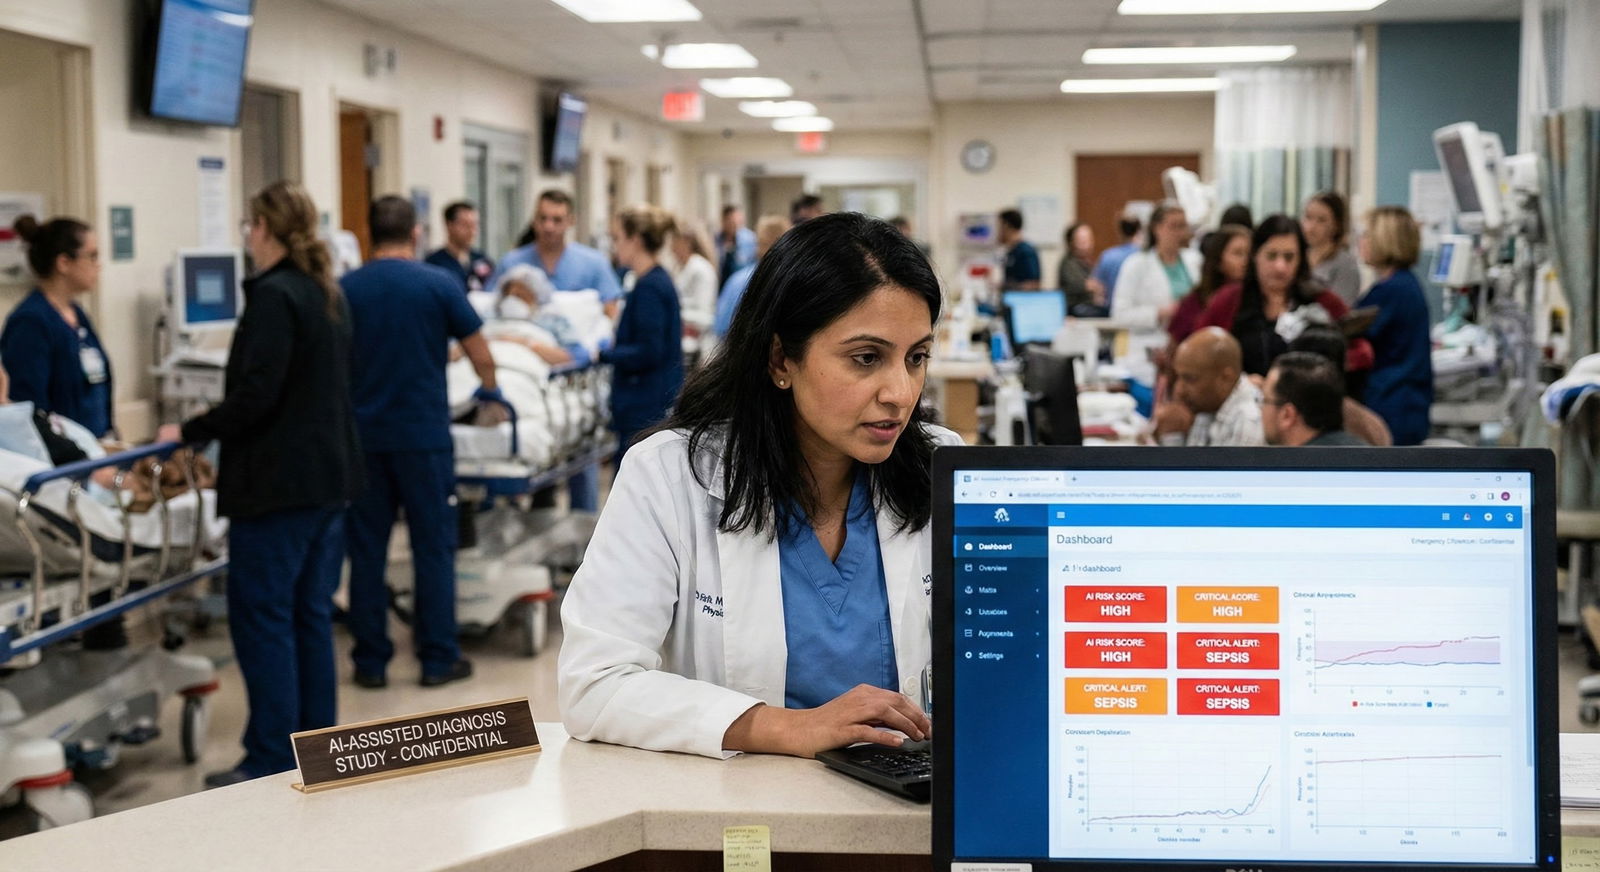
Mitigation should match the drift signature.
- Recalibration if discrimination is stable but predicted probabilities are off
- Threshold adjustment if sensitivity can be restored without intolerable over-triage
- Retraining if core feature relationships or discrimination have degraded
- Hybrid rules if you need temporary guardrails, such as mandatory clinician override for high-risk complaint clusters
I am opinionated here. Blindly retraining every time a metric twitches is sloppy. But refusing recalibration because "the AUROC still looks good" is worse.
Implementation Blueprint: Analyzing Drift in Real Time After Early Launch
The data shows that drift programs succeed when they are operationalized, not romanticized.
A practical blueprint looks like this:
Data pipeline QA
- Validate missingness, timestamp order, feature completeness
- Monitor latency for vitals, arrival mode, and triage notes
Label availability tracking
- Estimate what fraction of encounters have final labels
- Freeze monthly reports only after label completeness clears a preset threshold
Nightly metric recalculation
- Rolling AUROC
- Rolling ECE
- Sensitivity at triage threshold
- Under-triage per 1,000
Statistical process control
- Shewhart or EWMA charts for rapid detection
- Trigger review for consecutive points beyond warning limits
Prospective validation loop
- Retrospective threshold re-simulation
- Limited A/B or stepped-wedge deployment
- Quarterly or trigger-based calibration refresh
If you want one hard rule, use this: never trust launch metrics beyond the launch context. Revalidate after workflow change, seasonal shift, EHR update, or staffing redesign. Every time. I have seen "minor" triage form revisions produce bigger performance changes than major model updates. That is how messy real deployments are.
Summary: What We Learn When We Compare Drift vs Early Launch Data
The data shows the central lesson clearly: performance drift in AI ED triage is usually visible first in calibration and under-triage, not in AUROC. That is why teams that monitor only discrimination miss clinically important harm.
Early-launch data is useful, but only as a baseline under surveillance. The right comparison framework includes threshold-linked sensitivity, under-triage per 1,000 visits, calibration metrics, operational outcomes, and subgroup stability. Anything less is incomplete. Sometimes dangerously incomplete.
My position is simple. If your triage model is not tied to explicit safety gates, regular subgroup audits, and action rules for recalibration or retraining, then you do not have governance. You have hope dressed up as analytics. Emergency care deserves better. The numbers can tell you when drift starts. You just have to bother looking.